
REGIONAL INFORMATION:
Friuli-Venezia-Giulia / Italy
Area: 7.858 km²
GDP (PPS per inhabitant): 27.500
GDP Index EU 27: 116,2
Development based on SMEs model in the following sectors (industrial districts): Textile and furniture industry, Manufacturing (knives), Food-processing industry; Electrical industry, Shipyard, Insurance companies, Tourism


If you are not yet a member you can register here.
| PROINCOR | Proactive Innovation Support for SMEs in the Corridor from the Baltic to the Mediterranean Sea | |
 |
Regional partner(s): |
|
| CEBBIS | Central Europe Branch Based Innovation Support | |
 |
Regional partner(s): |
|
| ACCESS | ACCelerating regional competitivenESS and sector-based excellence through innovation management tools and techniques | |
 |
Regional partner(s): |
|
| CluStrat | Boosting innovation through new cluster concepts in support of emerging issues and cross-sectoral themes | |
 |
Regional partner(s): |
|
| CENILS | Central European Network for knowledge based on Innovative Light Sources | |
 |
Regional partner(s): |
|
| CentralCommunity | Emerging communities for collective innovation in Central Europe | |
 |
Regional partner(s): |
|
| SoNorA | SOuth-NORth Axis | |
 |
Regional partner(s): |
|
| CHAMPIONS | Improvement of CE regions’ accessibility through air transport interconnectivity | |
 |
Regional partner(s): |
|
| BATCo | Baltic-Adriatic Transport Cooperation | |
 |
Regional partner(s): |
|
| EMPIRIC | Enhancing Multimodal Platforms, Inland waterways and Railways services Integration in Central Europe | |
 |
Regional partner(s): | |
| INWAPO | Upgrading of Inland Waterway and Sea Ports | |
 |
Regional partner(s): |
|
| EDITS | European Digital Traffic Infrastructure Network for Intelligent Transport Systems | |
 |
Regional partner(s): |
|
| GOVERNEE | Good Governance in Energy Efficiency | |
 |
Regional partner(s): |
|
| INCA-CE | INCA Central Europe – Integrated nowcasting system for the Central European area | |
 |
Regional partner(s): | |
| EnergyCity | Reducing energy consumption and CO2 emissions in cities across Central Europe | |
 |
Regional partner(s): | |
| GreenNet | Promoting the ecological network in the European Green Belt | |
 |
Regional partner(s): |
|
| CEP-REC | Introduction of Regional Energy Concepts | |
 |
Regional partner(s): |
|
| CEC5 | Demonstration of energy efficiency and utilisation of renewable energy sources through public buildings | |
 |
Regional partner(s): |
|
| CEEM | Central Environmental and Energy Management as a kit for survival | |
 |
Regional partner(s): |
|
| HELPS | Housing and Home-care for the Elderly and vulnerable people and Local Partnership Strategies in Central | |
 |
Regional partner(s): |
|
FOKS – Arcade in Treviso (IT)
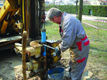
The aim of Integral Pumping Tests application in the Pilot Area in Arcade is to identify the source of groundwater pollution (PCE), previously detected in local groundwater in a single well named AR3. The potential source was identified on the basis of the IPT tool application, consisting in some pumping cycles in No. 4 wells, 3 of whom are new executed. All the hydrogeological system is also monitored by a specific monitoring network, set up with suitable piezometers, some of whom drilled during the Foks Project.
Pilot area is located in Arcade and the survey has been focused on a limited area in the southern part of the municipality territory, with the aim to identify the PCE contamination pattern in the area immediately upgradient of the AR3 well. At the moment the narrow monitoring network is made up by MW1, MW2, MW3, MW4, AR3, AR16, AR17.

Figure 1 – City of Arcade and location of the monitoring wells
What has been realized:
The investment action of the Province of Treviso was characterised by 3 main phases:
– First phase: acquisition of knowledge about the hydro-geological situation of the pilot area and of the spread of the contamination in the groundwater; in this phase, the following activities were carried out: video-inspection in the AR3 well, drilling of the MW1 and MW2 piezometers and part of the chemical analysis in the groundwater
– Second phase (characterized by the main activity in the pilot area): first pumping cycle with IPT in the AR3 well and, on the basis of the results of the chemical analysis, it was possible to define the location of the wells for the IPT (P1, P2 and P3); drilling of 3 wells and same number of pumping cycles with additional water analysis;
– Third phase: the information acquired during previous activities were used to better identify the source of contamination; for this reason, the MW5 piezometer was drilled and chemical analysis with passive sampling and low-flow methods were performed; the aim was to determine the spread of the concentration (in depth) and suppose the “distance” and the
characteristics of the source.
Total count: n° 155 chemical analysis of which 100 only of chlorinated solvents and 55 complete analysis; n° 32 chemical analysis with passive sampling and n° 32 chemical analysis with active lowflow sampling.
The study area is located in Veneto alluvial plain and is characterized by sandy gravel alluvium deposits with high values of hydraulic conductivity (10-1- 10-3 cm/sec) where an unconfined aquifer exists (groundwater depth = 20-30 m below ground level).
Locally there are some aquitards composed by silty – clay layers or cemented gravel.

Figure 2 – stratigraphic structure
The stratigraphic and hydrogeological model has been improved in the macroscale field since it was not clear or exhaustive enough and for this reason all the borehole information on the area has been acquired.
During the monitoring campaign a submersible pump (Grundfos MP1) with an inverter device for pumping rate regulation has been used in all the wells and all sampling has been performed at low-flow, in order to minimize aquifer disturbance and to avoid resuspension of settled solids. Every time sampling followed a purging step in order to collect a representative sample of the aquifer physical and chemical characteristics. Samples have been stored in bottles of appropriate material, labelled, in refrigerated container and then delivered to the laboratory.
The analysis plan defined by the laboratory concerned these parameters:
- 1,1,1-trichloroethane
- trichloroethylene
- tetrachloroethylene (PCE)
- chloroform
- carbon tetrachloride
- dibromochloromethane
- 1,2-dibromoethane
- bromoform
- 1,2-dibromo-3-chloropropane
- chlorinated solvents
The chemical status of the aquifer is summirized by the following table, indicating PCE concentrations determined by well sampling in the period May – September 2010. Concentration above the groundwater regulatory threshold value (1,1 μg/L), stated by the annex 5 to the fourth part of the Legislative Decree n. 152/2006, are marked.

Table 1 – PCE concentrations detected during the last monitoring campaigns
Data evaluation leads to some conclusions:
- AR3, MW1 e MW2 show the excess of the regulatory limit;
- even the other wells of the narrow monitoring network show presence of PCE although below the limit;
- all the other parameters are below the regulatory applicable limit and sometimes even below the detection limit;
- the vertical PCE concentration pattern, resulting from the 08/07/2010 GW sampling in MW3 and MW4, did not show any differentiation in relation to the depth: the average concentrations, showed in table 1, are, respectively, 0.35 μg/L and 0.12 μg/L;
A preliminary IPT test has been performed in the existing AR3 well in the period from 08.09.10 to 13.09.10. The planned 3 new IPT wells (P1, P2, P3) are currently going to be drilled, the IPT tests are scheduled to start on December 2010.
IPT planning
The first Integral Pumping Test was conducted in a single well (AR3) for 83 hours of continuous pumping (Q = 0.02 m3/s) with 15 time steps of sampling.
During the planning of IPT it was made an estimation of maximum capture area of the pumping well and calculation of time steps for groundwater sampling, on the basis of previous hydrogeological information derived from the WP3 activities conducted in the first periods of the Foks Project .
The results of IPT from the well AR3 were evaluated for PCE concentration by using the analytical software developed in the frame of the Project MAGIC (INTERREG IIIB CADSES) – the MAGIC Software tool.

Figure 3 – AR3 well location and groundwater flow direction
The hydrogeological context was sufficiently well-known and the parameters used as inputs for the interpretation tool MAGIC are the following:
- k (hydraulic conductivity) = 2.2 e-3 m/s
- ne (effective porosity) = 0.2
- i (hydraulic gradient) = 0.0017
- b (saturated aquifer thickness) = 20 m
With a pumping rate of 20 l/s the width of the capture zone at the end of the test is estimated to be around 42.7 meters.

Figure 4 – Sensitivity testing for IPT planning
Based on these data, the MAGIC tool analytical model calculate the width of the capture zone and the increase of width at each sampling interval. The final sampling intervals have been chosen in order to achieve an equal increase of width for each step. This results has been obtained foreseeing 15 samples with increasing time gap (the first one after 0.4 hours from the beginning of pumping, the second after 1.6 hours, the third after 3.6 hours and so on).
The result of this estimation has been compared with a numerical solution (Modflow 2000), to confirm the extension of the capture area and the validity of the hydrogeological parameters. This way the analytical model included in MAGIC has been calibrated with a finite difference model, gaining more accuracy and reliability.
IPT implementation
The IPT test in AR3 well has been performed with a submergible pump placed in the well after the removal of the equipment used by the owner for garden irrigation. Pumping rate has been hold constant and equal to 20 L/s for 83 hours during which the samples have been collected.
The groundwater withdrawn from the well has been discharged in an artificial irrigation ditch through a provisional tube.
IPT test followed a calibration step of the pumping regulation system, pumping rate has been measured with a Woltmann volumetric flowmeter. A sampling cock has been installed directly on the tube in order to collect GW samples causing the least disturbance. Before the beginning of the IPT test groundwater depth has been measured in AR3 and also in MW1, MW2, MW3, MW4 and AR16 wells with data logger for continuing GW level
measurement and registration.
Results
Times of taking sample during IPT in AR3 are stated in the following table, with PCE values detected:
The chemical results have been processed with the Circle Method interpretation included in MAGIC software tool; it was assumed left or center plume passage, obtaining the following values of measured and calculated PCE concentration in relation to the distance from the pumping well:

Table 2 – Results of IPT in AR3

Table 3 – Interpretation of results considering the plume passage
The graphical representation of the “time vs. concentration” data series is shown in the next two pictures:

picture

picture
Both left and center plume passage interpretations indicate a decreasing trend of PCE concentration, reaching at the end of the test a value included in the range of 1.4 – 2.8 μg/L, equivalent to the 5-8 % of the initial concentration.
So, according to the IPT interpretation theory, we can consider that in the beginning of the test we detected the center of the PCE plume and later, increasing the radius of the capture area, we came close to the lateral bounds of the plume.
Data interpretation is not unambiguous because a single IPT test does not allow to locate the plume on the left or on the right of the well. Anyway the IPT test helps to identify the spatial distribution of contamination inside the investigated area and the probable position of the plume IPT performing in 3 new wells upgradient AR3 named P1, P2 and P3, currently under execution, will give a better definition of the contamination plume.
Besides chemical results, also GW level data, recorded in MW1 MW1, MW2, MW3, MW4 e AR16 during IPT test, have been elaborated.
The following graphic shows the trends of data from September the 5th to 13th. The maximum equilibrium drawdown recorded in AR3 was about 1.6 m.
Monitoring wells did not show any influence of the pumping test. In fact the general decrease of the water level, as shown in the graphic, is the same regardless the pumping action in AR3.
As a consequence the actual position of monitoring wells did not allow to collect useful data for the hydrogeologic characterization of the aquifer during IPT because the nearest well, MW1, is out of the capture zone of AR3.
The recovery curve shows an almost instantaneous recovery of the groundwater level right after the switch off of pumping, thus confirming a grat capacity of recharge of the aquifer.

CEC5 – Demomstration building: Installation of photovoltaic glass on the old municipal slaughterhouse in Udine (IT)
In December the public procurement started and it ended in April 2013 with the selection of the contractor. The intervention will be made on the old municipal slaughterhouse.
The outer facades and the main walls will be unchanged: the interventions will be done inside. The main outside intervention is the realization of a photovoltaic generator system made of photovoltaic laminated safety glass installed roof and an appropriate metal frame. The system is built from a single glass hardened and treated HST. The stratigraphy includes the use of a package defined as: glass, PVB, photovoltaic cells, PVB and glass. In order to achieve even better thermal insulation glass with insulating properties like triple glazed insulating photovoltaic glass units will be used. The benchmarks for the design are: extra-clear glass top 4 to 6 mm; extra-clear or float back 4 to 15 mm; photovoltaic cells to 5-inch monocrystalline silicon a minimum output of 145 Wp/sqm; according to UNI 7697, IEC 61215, 61730, UNI EN ISO 12543
1-6, UNI EN 12600, UNI EN 356.
At the ground floor it will set up a permanent exhibition with panels and other devices to explain in detail the main features of the FV plant and how it works. The design foresees the following actions for energy efficiency and saving:
– installation of a general energy management system for the whole building;
– improvement of wall insulation;
– use of low temperature heating systems;
– installation of an innovation photovoltaic plant;
– use of energy saving lights;
– use of water saving measures
The city will benefit from the investment and the intervention, because a completely dismissed area and buildings will be recovered and reconfigured to create cultural activity zones, utilising passive technologies to create tempered environments between refurbished existing structures.
CEP-REC – Results of energy analysis in Friuli-Venezia-Giulia (IT)

The capital is Trieste and the territory comprises mountains (42.5 %), hills (19.3 %) and plains (38.2 %). The region’s economy is diverse and includes agriculture, manufacturing and building industries, commerce, tourism and others.
The Region has a high energy dependence, importing solid and liquid fuels, as well as natural gas that in 2003 amounted to 94.8 % compared to the national level of 91.3 %. However the growth of renewables has lowered energy imports at regional level, although they still remain rather high compared to other EU countries.
RES play a relevant role at regional level: hydro power is the first renewable energy source, followed by biomass and solar PV. RES at regional level increased remarkably in the last years, in particular solar PV supply and bioenergy consumption. The overall RES-E installed capacity amounts to 1 078 MW, 31 % of the total electricity capacity. The breakdown of total final energy consumption at regional level shows that energy demand in 2008 was primarily driven by the industrial sector (44 %), followed by transport (21 %), household (18 %) and finally commerce and public sectors (17 %). Regarding energy carriers, natural gas (methane) was the main one in 2008, followed by electricity, liquid fuels (oil), solid fuels and renewables. Natural gas is used in the industrial sector, in thermo-electrical installations and distributed into regional grids.
Hydro power will retain a dominant position
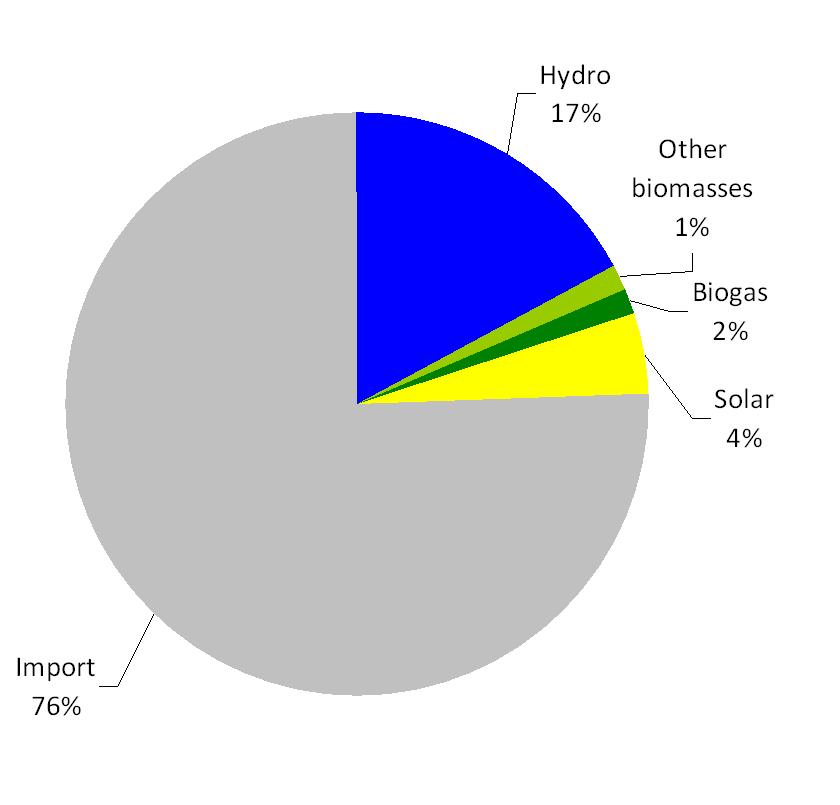
Electricity production by renewable energies (2012)
Looking to the future, hydro power will retain a dominant position in the RES-Electricity mix, however its future exploitation may be constrained by environmental factors. Meanwhile other RES sources, such as Solar PV and bioenergy sources have gained a market share. Solid biomass from forest, agricultural and waste sources have a remarkable untapped potential. In particular in the heat sector there is much potential from wood in mountain areas, as only one fifth of the annual forest increment is being harvested. Also crop residues can be used to increase the RES-Heat share.
Contact:
FRIULI VENEZIA GIULIA Autonomous Region
www.regione.fvg.it